


Latest Accolades

Color Earns Top Sustainability Ratings from CDP!
We’re proud to share that Penn Color has been awarded a B rating from the Carbon Disclosure Project (CDP) for climate and a B- for water responsibility! This recognition reflects our ongoing commitment to sustainability over the past 12 months. With over 25,000 companies reviewed annually, this distinction places Penn Color among the top-rated SMEs in environmental impact and risk management. Sustainability is at the core of what we do, and we’re excited to continue driving positive change for our industry and the planet!

Scope 1 & 2 carbon emissions assessment and build out strategy to meet SBTi standards

Scope 3 carbon emissions assessment and establish strategic supplier alignment to meet SBTi Scope 3 standards

Carbon reduction modeling and establish roadmap to achieve 2030 & 2035 emission reduction targets

Transformation of Business Strategy & Decarbonization Targets

Initiate Decarbonization Actions

Achieve SBTi Independent Recognition and Validation
Drive to 2023 Decarbonization Targets
Scope 1 and 2 Carbon Inventory Align Existing Initiatives with Decarbonization

Scope 3 Carbon Inventory and Supply Strategy Alignment
Carbon Reduction Modeling and Establish 1,3, and 5-year Initiatives

Establish Roadmap Resource Requirements
Transformation of Business Strategy & Decarbonization Targets
Initiate Decarbonization Actions

Compose 1st Annual Sustainability Report
Achieve SBTi Independent Recognition and Validation
Drive to 2023 Decarbonization Targets
Road Map to
Carbon Neutrality
Penn Color is engaged on a journey towards carbon neutrality in 2050. This effort comes in addition to the contribution that Penn Color makes by offering products that enable the sustainability goals of our customers. The journey has started with the careful selection of methods and standards, followed by the calculation of our carbon footprint. We are working with the best-in-class GHG/Carbon Footprint experts and software providers. We believe it is essential to invest in building the most detailed and robust possible model upfront, to set credible and achievable GHG/Carbon Footprint reduction goals.
-
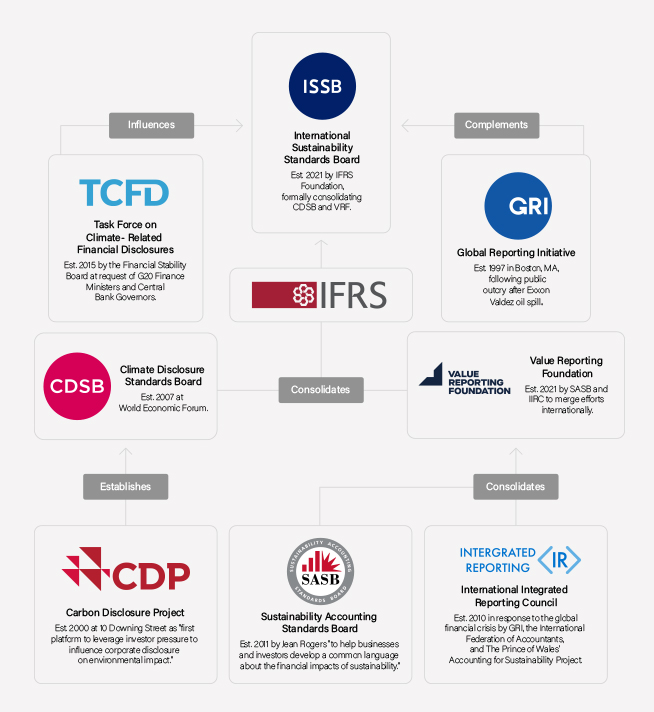
Following Best-in-Class Sustainability Standards
The International Sustainability Standards Board establishes methods and standards to unify corporate climate disclosures.
For both the measurement of our GHG emissions and establishing our reduction goals, Penn Color follows a strategy and uses tools that are globally accepted, as per the ISSB.
-
Using Best-in-Class Tools to Measure Our Carbon Footprint
With the ultimate target of alignment with SPTi (Science Based Targets Initiative), Penn Color has completed the calculations of our Scope 1 and Scope 2 emissions. We are now in the process of establishing our Scope 3 emissions, working with all key suppliers. We are working with Persefoni (one of the leading GHG/Carbon Footprint software providers) and Persefoni Net Zero Navigator as our primary resource to establish our GHG measurement and to set our goals for GHG reductions.
-
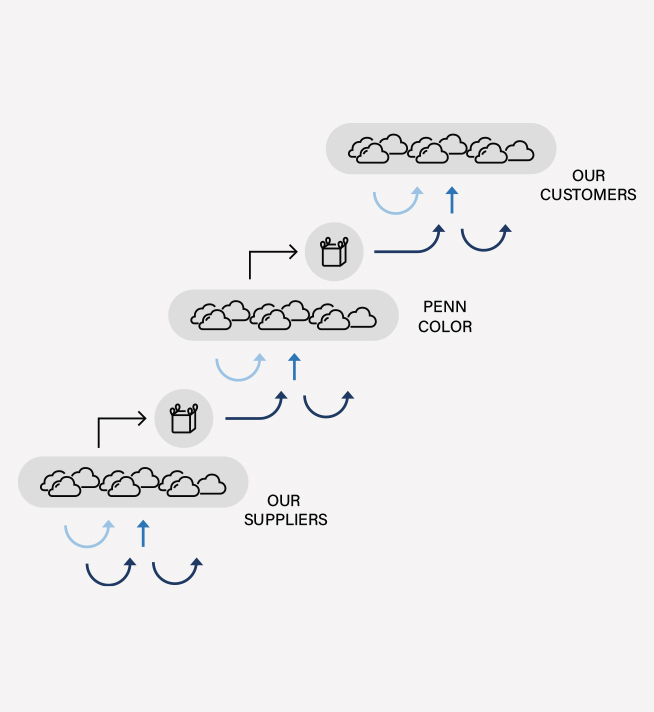
Alignment Up & Down the Value Chain
Our carbon footprint directly impacts our customers' Scope 3, through the goods and services they buy from us. The same applies to Penn Color, through the goods we buy from our suppliers, including raw pigments, additives, and resins.
Scope 3 is likely the largest contributor of GHG for both Penn Color and our customers. Establishing the proper GHG measurements and setting our goals for GHG reductions, is the opportunity to align our journey with our customers.
-
Measurement Methods & Standards
Following Best-in-Class Sustainability Standards
The International Sustainability Standards Board establishes methods and standards to unify corporate climate disclosures.
For both the measurement of our GHG emissions and establishing our reduction goals, Penn Color follows a strategy and uses tools that are globally accepted, as per the ISSB.
-
Our Carbon Footprint
Using Best-in-Class Tools to Measure Our Carbon Footprint
With the ultimate target of alignment with SPTi (Science Based Targets Initiative), Penn Color has completed the calculations of our Scope 1 and Scope 2 emissions. We are now in the process of establishing our Scope 3 emissions, working with all key suppliers. We are working with Persefoni (one of the leading GHG/Carbon Footprint software providers) and Persefoni Net Zero Navigator as our primary resource to establish our GHG measurement and to set our goals for GHG reductions.
-
Our Customer’s Footprint
Alignment Up & Down the Value Chain
Our carbon footprint directly impacts our customers' Scope 3, through the goods and services they buy from us. The same applies to Penn Color, through the goods we buy from our suppliers, including raw pigments, additives, and resins.
Scope 3 is likely the largest contributor of GHG for both Penn Color and our customers. Establishing the proper GHG measurements and setting our goals for GHG reductions, is the opportunity to align our journey with our customers.
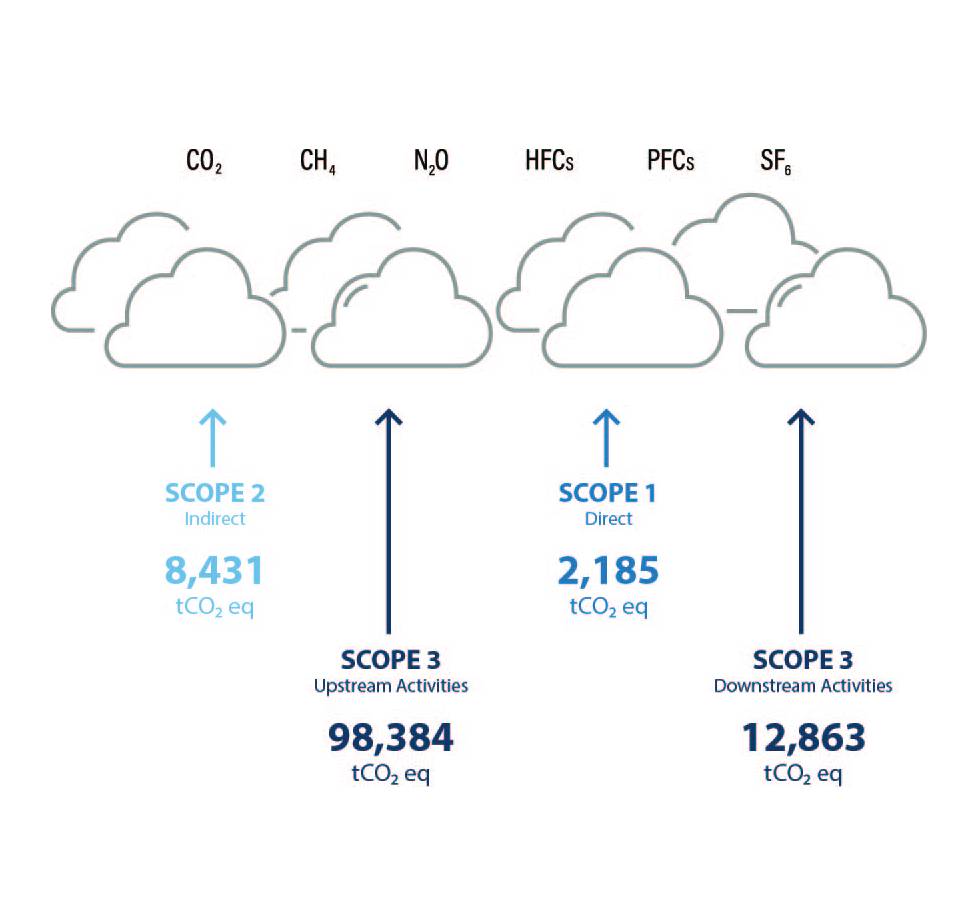
GHG Initiatives on Scope 1 & 2
9% of Penn Color's GHG/Carbon footprint comes from Scope 1 emissions (direct emissions from owned or controlled sources) and 8% from Scope 2 emissions (indirect emissions from the generation of purchased energy). These are the emissions that are the most straightforward to impact. Our efforts on Scope 1 and 2 focus on reducing our energy consumption, using green energy, and producing our own green energy.
-
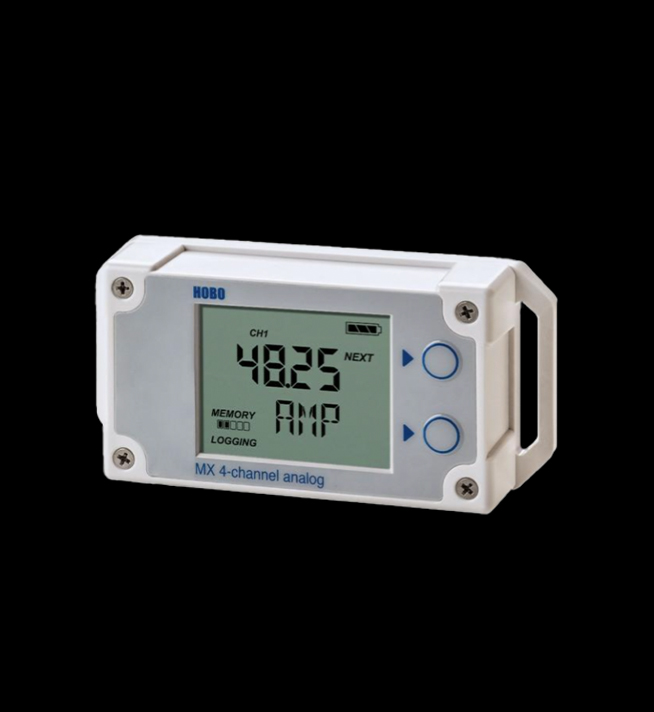
Live Tracking of Our Energy Consumption by Equipment
The majority of our Scope 1 and 2 GHG emissions come from our consumption of fossil fuel-based electricity. We are targeting all possible pathways toward improved efficiency and productivity, starting with the highest energy-demanding product lines.
We are utilizing energy tracking technologies to determine the current state of consumption and then establishing multifunctional teams to develop opportunities for the reduction in energy consumption while maintaining the level of quality we provide to our customers.
We recently invested in new, energy-efficient lighting in our facility in Milton, Wisconsin, and are in the process of doing the same in Hatfield, Pennsylvania.
-
Increasing the Share of Green Energy
We are increasing the share of green energy in our overall consumption.
We are working with our energy broker to increase the amount of green energy we purchase at each of our facilities in the U.S.
Our new facility in Thailand was built in an industrial park with an infrastructure in place that is capable of supplying over 70% green energy to power our plant.
-
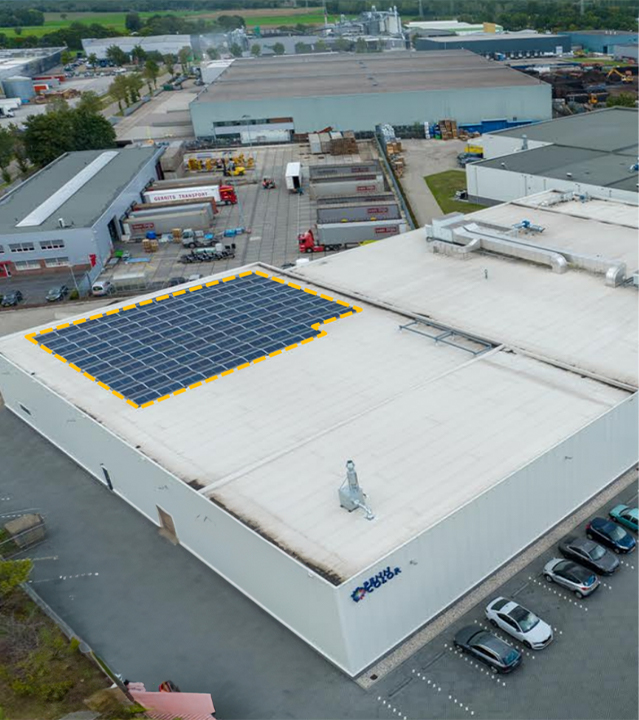
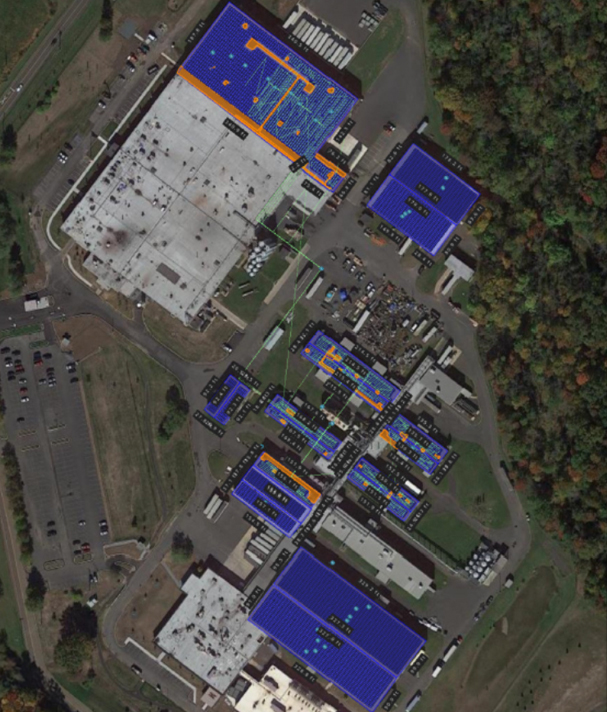
Deploying Viable Solutions to Create Green Energy
We are increasing our capabilities to create our own green energy.
The solar energy that we create at our European facility removes over 450 tons of CO2eq from our GHG emissions annually.
We are evaluating several pathways to increase our green energy production in Europe, over the next several years, as technologies for solar energy creation and storage evolve.
-
Reduce Energy
Live Tracking of Our Energy Consumption by Equipment
The majority of our Scope 1 and 2 GHG emissions come from our consumption of fossil fuel-based electricity. We are targeting all possible pathways toward improved efficiency and productivity, starting with the highest energy-demanding product lines.
We are utilizing energy tracking technologies to determine the current state of consumption and then establishing multifunctional teams to develop opportunities for the reduction in energy consumption while maintaining the level of quality we provide to our customers.
We recently invested in new, energy-efficient lighting in our facility in Milton, Wisconsin, and are in the process of doing the same in Hatfield, Pennsylvania.
-
Use Green Energy
Increasing the Share of Green Energy
We are increasing the share of green energy in our overall consumption.
We are working with our energy broker to increase the amount of green energy we purchase at each of our facilities in the U.S.
Our new facility in Thailand was built in an industrial park with an infrastructure in place that is capable of supplying over 70% green energy to power our plant.
-
Produce Green Energy
Deploying Viable Solutions to Create Green Energy
We are increasing our capabilities to create our own green energy.
The solar energy that we create at our European facility removes over 450 tons of CO2e from our GHG emissions annually.
We are evaluating several pathways to increase our green energy production in Europe, over the next several years, as technologies for solar energy creation and storage evolve.
GHG Initiatives
on Scope 3
83% of Penn Color’s GHG/Carbon footprint comes from Scope 3 emissions (all indirect emissions in the value chain from goods purchases and production and transportation of goods to use and disposal of products by customers and end-of-life treatment), Scope 3 is complex, specifically given the diversity of both our raw materials (upstream) and customer applications (downstream). Our focus is on the most impactful factors, including material supply, internal usage of goods, and freight.
-
Adding Carbon Footprint as a Key Selection Factor for Our Raw Materials
Carbon footprint is increasingly becoming one of the key criteria Penn Color’s supply chain uses to select our raw materials, besides the usual criteria including performance, quality, and costs. In some cases, we even find opportunities to use materials with a negative footprint.
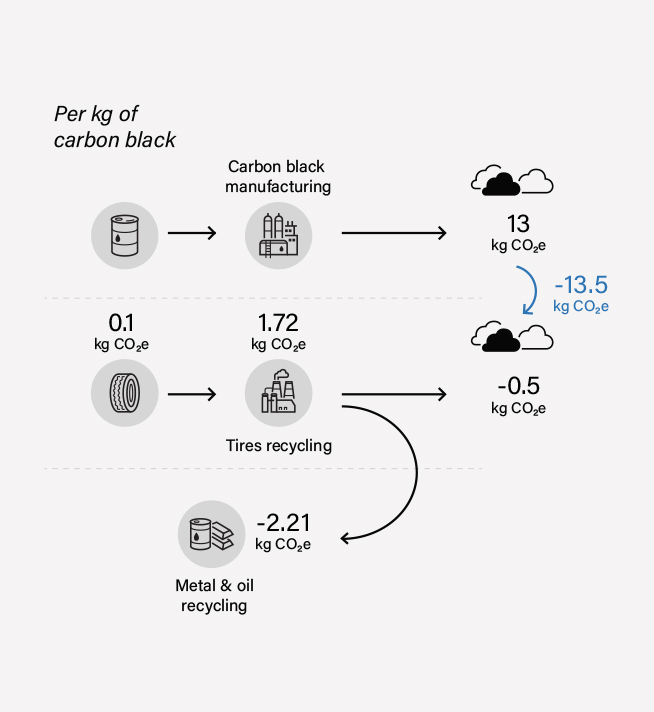
For example, carbon black is a material used in large quantities in our products. Carbon black is typically produced from hydrocarbon fuel and has a carbon footprint of 13kg CO2eq per kg.
Penn Color is working with a supplier who produces carbon black from used tires. The carbon footprint of this manufacturing process is more than offset by its by-products (steel and oil), leaving carbon black with a carbon footprint of -0.5kg CO2eq per kg.
-
Switching to Sustainable Transportation with Low and zero-Emissions
As is the case for most companies manufacturing industrial consumable materials, the carbon footprint associated with inbound freight of raw materials and outbound freight of finished goods is a big part of our Scope 3 upstream and downstream GHG emissions.
We are increasingly switching to sustainable transportation with low and zero-emissions, including electric and alternative-fuel vehicles, as well as domestic fuels.
We are using tools such as Telematics™ to add the dimension of carbon footprint in addition to the typical time and cost criteria when considering different shipping options.
-
Making a Difference, One Shift to Low CO2 eq Solution at the Time
Penn Color internal consumption of purchased goods not related to raw materials, contribute to upstream GHG emissions. Nitrile gloves, cardboard buckets, reems of copier and printer paper, … all add up to several tons of CO2 eq annually.
We are exploring all opportunities to reduce consumption wherever possible and to switch to alternative approaches with a proven lower GHG emissions profile.
-
Material Supply
Adding carbon footprint as a key selection factor for our raw materials
Carbon footprint is increasingly becoming on the key criteria Penn Color supply chain uses to select of our raw materials, beside the usual criteria including performance, quality and costs. In some cases, we even find opportunities to use materials with a negative footprint.
For example, carbon black is a material used in large quantities in our products. Carbon black is typically produced from hydrocarbon fuel and has a carbon footprint of 13kg CO2eq per kg.
Penn Color is working with a supplier who produces carbon black from used tires. The carbon footprint of this manufacturing process is more than offset by its by-products (steel and oil), leaving carbon black with a carbon footprint of -0.5kg CO2 eq per kg.
-
Freight
Switching to Sustainable Transportation with Low and zero-emission
As is the case for most companies manufacturing industrial consumable materials, the carbon footprint associated with inbound freight of raw materials and outbound freight of finished goods is a big part of our Scope 3 upstream and downstream GHG emissions.
We are increasingly switching to Sustainable Transportation with low and zero-emission, including electric and alternative-fuel vehicles, as well as domestic fuels.
We are using tools such as Telematics™ to add the dimension of carbon footprint in addition to the typical time and cost criteria, when considering different shipping options
-
Internal
Making a Difference, One Shift to Low CO2 EQ Solution at the Time
Penn Color internal consumption of purchased goods not related to raw materials, contribute to upstream GHG emissions. Nitrile gloves, cardboard buckets, reems of copier and printer paper, … all add up to several tons of CO2eq annually.
We are exploring all opportunities to reduce consumption wherever possible and to switch to alternative approaches with a proven lower GHG emissions profile
We have the highest vitality index in the industry, creating thousands of new formulations every year. We either have a solution or we’ll create one for you. Please use SPARK, our solution finder to tell us what you are looking for.
SOLUTION FINDER